Finance/Lender Use

We have created an illustration of a portfolio comprising 1,000 properties in the Chichester region.
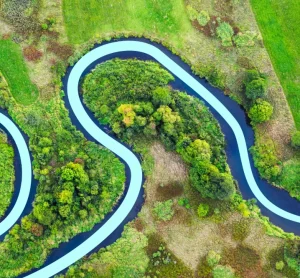
These properties were selected from a 600km2 area centred on Chichester on the South coast. The region was selected as containing flooding representative of all four main sources of flooding from coastal, river, surface water and groundwater sources.
The purpose of this selection is to illustrate:
- that flood is not a single peril but a combination of factors
- this distinction is extremely important when looking at exposure, damage and resilience or protection measures
- single peril/property interaction,which shows the resolution possible.
Emsworth
Finance Use Case
The property lender (bank, loan book etc) has a portfolio of 1,000 property loans in Chichester for which the property is collateral. The lender now wishes to understand the exposure of these properties to the different types of flood – the impact of a climate change scenario.
The results of this study could assist the lender, as follows:
- Establish a flood risk threshold – how much of the loan book’s portfolio is exposed to flood risk?
- Does the lender have a rate premium for this risk inherent in the asset?
- How does the lender understand the accumulation risk in this portfolio?
- How does the lender recognise the four different flood types that the borrower needs?
- Does the lender understand the cost of damage/vulnerability by specific flood type?
- Does this affect the asset value?
- Can the borrower finance the damage if insurance is not in place or is inappropriate?
- Are there borrower affordability issues in these scenarios?
- Should resilience finance be offered?
- Can the lender change the impact for climate change scenarios?
- Recognising the impact of more rainfall affecting the three relevant flood types
- Recognising the impact of higher sea levels (mainly affecting coastal and certain fluvial zones)
- Is the lender able to form a flood risk view with climate change that is consistent with the regulatory reporting and risk assessment requirements?
- Should the lender share the exposure detail on a policy basis with the borrower (ie. at house level detail) to create an ongoing relationship by which each party understands how risk should be managed, priced and transferred?
- The insurance policy is one-year duration – is it in place and appropriate?
- The borrower will need flood cover for years to come
- Is flood insurance a condition of a loan secured on the house?
FloodSmart Analytical Portfolio Results
We show our results in a table, by portfolio selection method (peril choice(s)) and then by exposure (peril values). Values have been established using the GeoSmart FAST* model to derive flood depth, probability and duration. FAST uses GeoSmart’s latest groundwater flood depth model, combined with data from the Environment Agency on the risk of flooding from surface water run-off, rivers and the coast.
This information, combined with our digital terrain model (DTM), supports a calculation engine that generates a probability distribution of flood depth and likely duration. A cost calculation is then performed, based on flood depth and property type to provide an indication of economic or financial losses for each event and as an average annual damage (AAD).
The case study uses an engineering calculation, assuming an average residential house following a similar approach to the Environment Agency, which can be cross referenced against actual claims data. The benefits of flood defences are excluded from the case study results.
The costs resulting from each type of flooding are available separately or as a combined AAD flood index. Clients also have the option to provide their own property and cost data or export data into their own cost models.
*FAST
FloodSmart Analytics uses GeoSmart’s significant technical hydrogeology and related expertise, which is contained in its proprietary flood model – FAST (Flooding from All Sources Tracker).
Basic view – FAST Model Results

Observations:
- 750 of the 1,000 properties have non-negligible exposure to one or more flood types
- Affected properties are shown to have some exposure to each of the four flood types
- Peril selected properties have higher risk damage values than random properties (as explained in the portfolio selection methodology)
- This shows that careful risk selection is critical to limiting portfolio risk
- Risk selection should be done by peril type and not just by combined flood
- Properties with exposure are likely to explain a high proportion of all flood-damaged properties. Flood risk is not generally random:
- It can be predicted with some accuracy which properties will be subject to severe flood risk
- There is less predictability with pluvial (surface water) flooding . This is to be expected due to the nature of the causal factors and highly localised consequences
- Properties selected in a particular risk category also suffer damages from other flood sources
- Flooding from multiple sources may coincide and, in the example, nearly half of the total AAD comes from less than 10% of the portfolio where properties are susceptible to all four sources of flooding. These sources can be regarded as independent and cumulative, and therefore adequate data on each source of flooding is essential. ‘Making do’ with a general flood map is unlikely to provide the insight required to manage the risk effectively.
- Groundwater shows a high potential AAD and presents a significant risk in susceptible areas due to the often long duration (months) of bedrock flooding and the widespread pervasive nature of saturated ground, which can affect building fabric and foundations.
- Even though groundwater flood depths and individual claim values are generally less than other flood sources, the large number properties that suffer the lower levels of attritional loss bring up the total portfolio AAD. The case study assumes costs for an average residential property, older, ‘less waterproof’ properties or those with a basement or buried services, will incur higher costs.
- The case study area was selected as being at significant groundwater risk, which could potentially contribute half of the total AAD from the chalk aquifer, which extends across significant parts of the UK. Groundwater damage will be significantly less in areas where aquifers are scarce.
Climate Change View – FAST Model Results
The climate change view – with same portfolio selection to show a constant comparison at each specific property – which might have led to a different portfolio choice if starting from scratch under this scenario. It should be noted that an alternative climate change scenario will also change the area, severity and mix of flood types.

Observations:
- The number of flood-affected properties has grown, caused by some of the negligible results turning positive. Portfolio is constant max size of 1,000
- Affected properties continue to have some exposure to each of the four flood types
- Peril selected properties continue have higher risk damage values than random properties (as explained in the portfolio selection methodology)
- Properties with exposure continue to explain a high proportion of all flood-damaged properties. Flood risk is not generally random:
- Climate change exacerbates risk damage, with an overall increase > 300% for non-random properties
- But an increase of >360% for the random properties, with much of this fluvial and tidal
- If we used an area view, instead of a fixed portfolio view, we would also find a significant increase in the amount of flood risk affected area. However, the amount of risk damage may not increase to a similar > 300% extent.
Climate change assumptions:
The following assumptions were made to illustrate the potential impacts of climate change. River and coastal flooding levels were raised by 0.5m and surface water flood levels were increased by 15cm and groundwater flood levels increased by 5cm.
Portfolio – zoom in details of central map area centred on Emsworth town – show that each policyholder property is identifiable, regardless of the size of the portfolio selected.
Emsworth – extreme location view