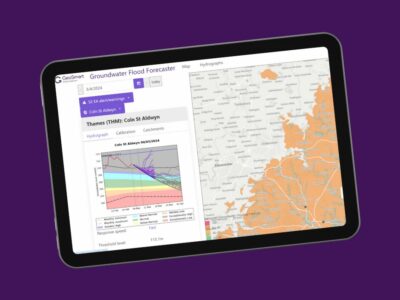
GeoSmart GW5
The definitive groundwater flood risk map data with unparalleled detail for clearer decisions.
GW5 incorporates the new 5m Digital Terrain Model (DTM) for enhanced resolution at an individual property level. With the latest LIDAR data from the Environment Agency, it reveals the complex relationship between terrain and “ponding” of groundwater.
Address level insight delivers better insurance premium risk calculation, legal due diligence in property transactions and smarter resilience planning.
Benefits
- A range of groundwater flood risk data products to suit information and format needs
- Market leading 5m resolution groundwater data delivers unsurpassed clarity at a property specific level
- Developers and local authorities can screen sites and portfolios for risks as part of cost appraisals, scheme design and planning requirements
- Land owners and solicitors gain a full assessment of issues ahead of completion or project start
GeoSmart GW5
- Admin fee may apply.
- Resolution: 5m
- Property specific
- Elevation data: Includes LIDAR
- Coverage: Great Britain
- Commercial licence
Frequently Asked Questions
Groundwater flooding occurs when sub-surface water emerges from the ground at the surface or into Made Ground and structures. This may be as a result of persistent rainfall that recharges aquifers until they are full; or may be as a result of high river levels, or tides, driving water through near-surface deposits. Groundwater flooding is characterised by:
- Water flows to the surface or into basements, services ducts and other subsurface infrastructure rising up through floors or directly from the ground. This may be seen as diffuse seepage from the ground, as emergence of new springs or as an increase in spring flows
- Flooding may last a long time compared to surface water flooding, from weeks to months. Hence the amount of damage that is caused to property may be substantially higher. Likewise closures of access routes, roads, railways etc. may be prolonged
- Flooding may occur with a delay following periods of high rainfall rather than immediately during storms
- Emergent groundwater tends to be clear and relatively clean compared to muddy fluvial flood waters, but potential contamination by sewers and brownfield sites poses additional hazards
- Groundwater flooding or a shallow water table prevents rainfall infiltration and increases the risk of surface water flooding. This means that many surface floods are actually driven by groundwater conditions. But consideration of surface water in isolation and lack of evidence for groundwater conditions leads to incorrect analysis of overall causes
Whilst groundwater flooding is generally less hazardous to human health than surface flooding, it is more hazardous to property for a given flood depth, producing 2 to 4 times the damage to building fabric and greater disruption to economic activity due to the longer duration of flood events. Also, the impact may be less about surface water depths or velocities and more about the extended saturation of the shallow subsurface with the following consequences:
- Damage to basements and other structures below ground
- Damage to infrastructure such as buried services and ducts
- Sewer flooding
- Water damage to property, cultural heritage, crops or sensitive habitats due to saturated conditions
- Leaching of contamination from brownfield sites and other sources of contamination
- Slope stability issues
- Increased likelihood, intensity and duration of surface water flooding due to saturated ground conditions and failure of infiltration drainage systems
- Increased cost of construction projects, which will need to incorporate preventive groundwater control measures to prevent what, would otherwise cause harm
Groundwater is one of the sources of flooding that may affect a location with potentially important consequences for properties and infrastructure, therefore a review of the groundwater flood risk for a site is recommended prior to a property transaction or property development. An initial screening review will be sufficient for most areas that are at negligible risk of groundwater flooding. Areas that may be at significant risk of groundwater flooding generally require a more detailed site-specific assessment. The Groundwater Flood Risk Map allows users identify whether groundwater may be a source of flooding at their site. It is available at multiple scales and risk resolutions.
The Groundwater Flood Risk map has full coverage over Great Britain. The map is available at multiple scales and risk resolutions:
GW5: The Groundwater Flood Risk map is available at 5m resolution for Great Britain. It classifies groundwater flood risk in every cell on a 5m grid covering Great Britain into one of 4 risk categories: Negligible, Low, Moderate, and High.
GW200-S: The Groundwater Flood Risk map is available on a 200m grid covering Great Britain as a Screening Map. It classifies groundwater flood risk for each cell on that grid into one of two categories: ‘Potentially At Risk’ and ‘Negligible Risk’, based on the maximum risk occurrence within that cell as represented on the higher resolutions products, GW5.
- House builders and developers
- Property professionals such as architects, planning consultants and land agents
- Lawyers and solicitors
- Lenders, banks or mortgage providers
- Businesses
- Private individuals
- Insurance companies
- Local Authorities and regulators
The map can tell you whether groundwater flooding is likely to be a concern at a specific site, and will provide recommendations based on the level of groundwater flood risk modelled for that site. However, it does not provide an alternative to a proper site-specific assessment, and a detailed risk assessment should be used for any site where the impact of groundwater flooding would have significant adverse consequences.
The map classification shows on a national mapping scale the areas within which property may be at risk, but this should not be mistaken to mean that groundwater floods will occur across the whole of the groundwater flood risk zones. Mapping limitations and a number of local factors may reduce groundwater flood risk to land and property even where it lies within mapped groundwater flood risk zones.
The groundwater flood risk model used to produce the map incorporates various national scale datasets including Terrain 50 topographical data produced by the Ordnance Survey, LIDAR Digital Terrain Models produced by the Environment Agency, 1:50,000 scale Geological Maps produced by the British Geological Survey, and Groundwater Level data produced by the British Geological Survey. Bespoke in-house hydrogeological and risk models were used to process this data and produce the Groundwater Flood Risk Map. A national database of recorded groundwater flooding events collated by GeoSmart from various sources is used to calibrate and validate the Groundwater Flood Risk Map.
Mapped classes combine our understanding of likelihood, model and data uncertainty and possible severity. Likelihood is ranked according to whether we expect groundwater flooding at a site due to extreme elevated groundwater levels with an annual probability of occurrence greater than 1%, taking into account model and data uncertainty. Severity relates to our expectations of the amount of property damage or other harm that groundwater flooding at that location might cause.
CLASS 4: NEGLIGIBLE RISK: There is a negligible risk of groundwater flooding in this area and any groundwater flooding incidence has an annual probability of occurrence of less than 1%.
Comments: No further investigation of risk is deemed necessary unless proposed site use is unusually sensitive. However, data may be lacking in some areas, so assessment as ‘negligible risk’ on the basis of the map does not rule out local flooding due to features not currently represented in the national datasets used to generate this version of the map.
CLASS 3: LOW RISK: There is a low risk of groundwater flooding in this area with an annual probability of occurrence of 1% or greater.
Comments: There will be a remote possibility that incidence of groundwater flooding could lead to damage to property or harm to other sensitive receptors at, or near, this location. For sensitive land uses further consideration of site topography, drainage, and historical information on flooding in the local area should be undertaken by a suitably qualified professional. Should there be any flooding it is likely to be limited to seepages and waterlogged ground, damage to basements and subsurface infrastructure, and should pose no significant risk to life. Surface water flooding, however, may be exacerbated when groundwater levels are high.
CLASS 2: MODERATE: There is a moderate risk of groundwater flooding in this area with an annual probability of occurrence of 1% or greater.
Comments: There will be a significant possibility that incidence of groundwater flooding could lead to damage to property or harm to other sensitive receptors at, or near, this location. Where flooding occurs it is likely to be in the form of shallow pools or streams. There may be basement flooding, but road or rail closures should not be needed and flooding should pose no significant risk to life. Surface water flooding and failure of drainage systems may be exacerbated when groundwater levels are high. Further consideration of the local level of risk and mitigation, by a suitably qualified professional, is recommended.
CLASS 1: HIGH: There is a high risk of groundwater flooding in this area with an annual probability of occurrence of 1% or greater.
Comments: It is likely that incidence of groundwater flooding will occur, with an annual probability of 1% or greater, which could lead to damage to property or harm to other sensitive receptors at, or near, this location. Flooding may result in damage to property, road or rail closures and, in exceptional cases, may pose a risk to life. Surface water flooding and failure of drainage systems will be exacerbated when groundwater levels are high. Further consideration of the local level of risk and mitigation, by a suitably qualified professional, is recommended.
This does not mean that the property will flood. The GeoSmart Groundwater Flood Risk Map is a national scale product that highlights areas where there is sufficient evidence to suggest that flooding could occur.However, there are a number of reasons why the national map may be indicating risk where there is no actual risk at a local scale (mapping limitations), and also a number of local factors that may protect land and property even where it lies within confirmed flood risk zones (property protection factors).
Mapping Limitations
Some of the main reasons why the map may be indicating risk in areas where flooding may not actually occur:
- The groundwater levels are produced from national scale mapping and models, which may not be representative at a local scale. The sparsity of reliable records of groundwater levels is an important limitation on national scale groundwater mapping and modelling.
- In some areas, only a coarse resolution DTM (50m) was available for use in the groundwater flood risk model, which can lead to poor resolution of shallow slopes, and the elevation of a site above an adjacent valley can be under-represented.
- Other constituent data-sets, including the geology datasets, are national-scale maps and may not represent local features accurately.
- Engineered works are not taken into account in the model. Similarly, artificial drainage works or groundwater pumping or control systems that would limit water table rise to the surface are not accounted for
Property Protection Factors
Some of the main reasons why property within areas at risk of flooding may avoid being flooded:
- National groundwater flooding models do not take into account the magnitude of flows emerging from the ground. Therefore while groundwater heads might be indicative of groundwater emergence, the actual amount of flow might not be sufficient to cause flooding at that location (although the accumulated flows downstream might be).
- Change in elevation locally may cause groundwater emergence to be localised away from the property, keeping the water table below hazardous levels at the property.
- Even if emergent groundwater was at a rate sufficient to cause local flooding, the nature of the urban man-made subsurface tends to drain water away before it reaches the surface. Sewers, granular fill around utilities and road sub-grade are all highly permeable formations that would be able to drain quite high groundwater flows away. This tends to move the groundwater flooding problem down the catchment.
- Drains on or near the property or other property protection such as break layers or membranes incorporated in the building may act to prevent water reaching locations where impacts would occur.
In summary, it is recommended that a more detailed risk assessment by a suitably qualified specialist should be undertaken for any sites that occur in mapped zones of groundwater flood risk where the impact of groundwater flooding would have significant adverse consequences. Decisions such as whether to proceed with a property transaction should not be made on the basis of the map classification alone. Even in the event that groundwater flood risk is confirmed through site-specific assessment, potential risk mitigation measures can usually be identified which could enable the property transaction or development to proceed.
The map is updated on a 6 month cycle to take advantage of newly released data as soon as it comes out.
The map has been through a rigorous internal QA process, and has been reviewed by external experts. At every update cycle, it is reviewed against a national database of groundwater flooding events to verify its validity.
Other sources of flooding should be considered in this case, which are not represented on the Groundwater Flood Risk Map. These include fluvial and tidal flooding, surface water flooding, and flooding produced by springs.
This suggests an important hydrological connection between the river and the groundwater in this area. Due to the groundwater contribution, flooding in this area may occur more frequently and for longer durations than would be expected from fluvial flooding alone.
The two most pervasive mechanisms of groundwater flooding are represented on the Groundwater Flood Risk Map. These are bedrock flooding and permeable superficial deposits flooding.Bedrock Flooding: After extreme rainfall, groundwater levels, in places, rise to intercept the ground surface. Rises in groundwater level may also be superimposed upon above average groundwater levels in the aquifer prior to the rainfall. Water tables typically reach the surface first in (dry) river valleys, where the emerging water can drain away. With increasing groundwater levels, the carrying capacity of the drainage channel is exceeded and a surface flood commences. This is also known as ‘clearwater’ flooding because of the relative clarity of groundwater compared to fluvial flood water.
Permeable Superficial Deposits Flooding: Where groundwater in permeable superficial deposits (PSD) is in good hydraulic contact with a river or the coast, flooding can occur during periods of high river stage or tide. This mechanism is particularly exacerbated when the PSD overlie low permeability strata.
If a depression is set back from the river, with a connection via PSD then this might be prone to groundwater flooding even if it is protected from overland fluvial flooding. In conditions of less extreme floods, groundwater flooding often occurs in flood plains due to high in-channel river levels, before the river overtops its bank, or after it has retreated back into its channel. It is therefore often difficult to distinguish from river flooding. Effectively, the subsurface flow path results in more extensive, frequent, and prolonged inundation of flood plains that occur on permeable superficial deposits connected to rivers.
Other mechanisms of groundwater flooding that are not represented on the Groundwater Flood Risk Map are:
- Groundwater flooding produced by spring flows that exceed normal conditions, and therefore overwhelm their drainage channels.
- Groundwater flooding as a result of water table rebound. The effect of rising groundwater levels beneath some cities, mineral extraction areas, or around water supply boreholes due to reduced abstraction has not been modelled.

Still have questions? Chat to our friendly team today
We value the quality of all that we do as critically important and our team is goal oriented
Martin Lloyd
Martin Lloyd Associates
Alan Gunne-Jones
Planning & Development Associates

We value and strive to achieve Service Excellence as the key to our success.